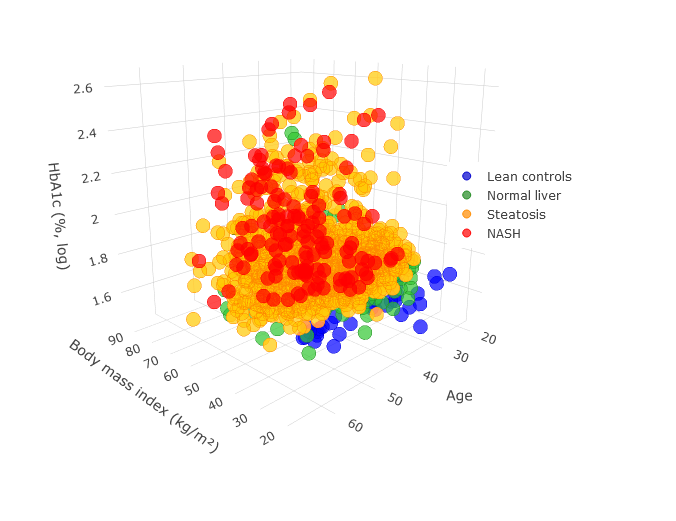
Abos cohort includes a broad range of available data for identification and validation of new biomarkers across multiple tissues
Biomarkers have advanced our knowledge on the etiology of obesity and its links with chronic diseases. They bring substantial promise in identifying effective public health strategies that pave the way towards patient stratification and precision prevention.
Abos cohort includes a broad range of available data for identification and validation of new biomarkers across multiple tissues in ABOS cohort
Our comprehensive solutions include:
- Scientific expertise in obesity, diabetes and metabolic diseases
Identification and validation of biomarkers in ABOS cohort:
- Customize case-control matching studies based on propensity score
- Tailor sensitivity studies (longitudinal biomarker analysis)
- Monitor biomarker response to weight loss surgery
- Biomarker-based risk stratification
- Stratification of disease progression (i.e Type 2 Diabetes, Non-Alcoholic Liver Disease…)
Biostatistical data analysis within ABOS cohort
- Our data analysis services within ABOS cohort can be applied to biomarker identification and validation, data visualisation and interpretation

CLINICAL DATA
BIOLOGICAL DATA
NON-INVASIVE SCORES
LIVER HISTOPATHOLOGY
OMICS DATA
CLINICAL DATA
Clinical Data
- Onset of obesity
- Onset of diabetes
- Associated Comorbidities
- Concomitant treatments
- Family history of diabetes and obesity
- Body Mass Index
- Weight loss after surgery up to 5 years
If diabetes:
- Duration of diabetes
- Therapeutic class of diabetes treatment used
- Diabetes status after bariatric surgery up to 5 years
Clinical data are collected before surgery and at 1, 3, 6, 12, 24 and 60 months after bariatric surgery.
BIOLOGICAL DATA
Fasting Biological Data
- Complete Blood Count
- Glycated hemoglobin (HBA1c)
- Total cholesterol, High density lipoprotein cholesterol (LDL), Low density lipoprotein cholesterol (LDL), Triglycerides
- Aspartate aminotransferase (AST), Alanine aminotransferase (ALT), Gamma glutamyl transferase (γGT) , Bilirubin
- Creatinine
- Acid uric
- Apolipoproteine A1
- Haptoglobine
- Alpha-2-macroglobuline
- Vitamins
- Oligoelements
Postprandial Biological Data
- Oral glucose tolerance test (OGTT): glucose, insuline, C-peptide at 0,30, 120 minutes after 75g glucose post-load (n ≃ 1500 subjects)
- Standardized Mixed Meal Test (MMT): glucose, Insulin, Cpeptide at 0, 15, 30, 60, 120, 240 minutes (n ≃ 100 subjects)
Biological data are collected before surgery and up to 60 months after bariatric surgery.
NON-INVASIVE SCORES
Non-Invasive Scores
- Body fat estimates by using the Body Adiposity Estimator (Clínica Universidad de Navarra-Body Adiposity Estimator; CUN-BAE), as proposed by (Gomez-Ambrosi J, Diabetes Care 2012).
- HOMA2 (Homoeostasis model assessment) estimates of β-cell function (HOMA2%-B), insulin sensitivity (HOMA2%-S) and insulin resistance (HOMA2%-IR) based on Insulin or C-peptide concentrations (University of Oxford, Oxford, UK) as described by Levy et al. Diabetes Care 1998)
- Matsuda Index estimates of Insulin sensitivity (Matsuda et al. Diabetes Care 1999).
- Insulinogenic Index estimates of first phase insulin secretion (Goedecke et al. Diabetes Care 2009)
- NAFLD (Non-Alcoholic Fatty Liver Disease) score estimates of liver fibrosis (Angulo et al. Hepatology 2007)
- Glomerular filtration rate (eGFR) estimates of renal function according to National Kidney F. K/DOQI clinical practice guidelines for chronic kidney disease: evaluation, classification, and stratification. Am J Kidney Dis 2002).
- Framingham risk score estimates of general cardiovascular risk profile (D’Agostino et al. Circulation 2008)
LIVER HISTOPATHOLOGY
Liver histopathology
- Steatosis is quantified by the percentage of hepatocytes containing fat droplets (amount of steatosis)
- Necroinflammatory activity is grading using the Brunt score which id defined by a 3-step scale: mild (grade 1, moderate (grade 2) and severe (grade 3) according to Brunt et al. Gastroenterology 1999 and Brunt et al. Hepatology 2011)
- NAFLD Activity score (NAS) is defined as the unweighted sum of scores for steatosis (0-3), lobular inflammation (0-3) and ballooning (0-2), ranging from 0 to 8 (Brunt et al. Hepatology 2011)
- Fibrosis is assessed using Kleiner (Kleiner et al. Hepatology 2005) and Metavir fibrosis score (Bedossa et al. Hepatology 1996). Kleiner was defined as follows: F0, normal; F1 stage is divided into 3 subclasses: 1a, mild pericellular fibrosis in zone 3, 1b, moderate pericellular fibrosis in zone 3, and 1c, portal fibrosis; F2, perivenular and pericellular fibrosis confined to zone 2 and 3, with or wothout portal or periportal fibrosis; F3, bridging or extensive fibrosis with architectural distorsion and no clear-cut cirrhosis; and F4, cirrhosis). Metavir score distinguishs between successive stages from normal liver (stage F0) to cirrhosis (F4) based on estimates of the transition rates during fibrosis progression.

OMICS DATA
Baseline Omics Data:
- Genomics (Genome Wide ASsociation)
- Proteomics (Mass Spectrometry)
- Metabolomics (Mass Spectrometry)
- Lipidomics (Mass Spectrometry)
- Liver transcriptomics (Affymetrix)
- Intestin transcriptomics (Affymetrix)
- Metagenomics (Whole-Genome Shotgun) before and at 3 months after surgery
Omics Data at 3 and 12 months after weight loss surgery :
- Metabolomics (Mass Spectrometry)
- Lipidomics (Mass Spectrometry)


